Post-mortem 2019Q1

It has been 3 months now since I started paper/virtual trading my Trend Following (TF) system. I started last January with a 50K capital. Where basically I was down by 10% by the end of that month. You can read my January review here. It was a hard (headed) month, with a lot of cut losses, jumping from one stock to the other, and trading setups that are not TF. In other words, Pasaway.
Then I finally found an accountability partner (AP) at the beginning of February. Who advised me to mirror my real port capital to my virtual port capital so that I'll get used to the same amount of money and figures. So I had to reset my vTrade port and had to close my only position left that month which had a 10% gain by that time.
I started a new virtual port with a new set of capital and have been making changes on my system every now and then based on what my journal is telling me. I am still -5.55% down at the end of the first quarter. A slight improvement from a -10% in January alone. I made 16 trades. 14 of which are cut losses, 1 accidentally closed (DMW) and 1 deliberately closed (CPM) because RFB was of hype reason.
My port is at a negative but my learnings has been building up.
So the following charts and tables only include February and March results as I reset my port at the end of January.
 |
| Q1 Portfolio Summary |
 |
| Q1 Analytics |

 |
| Q1 Closed Trades |
What works and what doesn't...
Journal...
My journal is the key to most of the changes and refinement in myself and in my system. What is there to improve or refine, if issues are not identified in the first place?Writing my trades on my journal ‘as it happens’ or immediately after market, helped me to get a more detailed information out of the trades. Most of the times, the trade ideas and the experience get lost the more I delayed writing them down.
Watchlist...
Looking back at my first watchlist from January, I had so many stocks listed, putting a considerable amount of stress on my first month of virtual trading. Imagine my 30 slots of investawatcher+ is full of my NOW, SOON and LATER list. My watchlist since then evolved and trimmed to just have my three to five ‘best trades’. This step allowed me lighten up on my daily routine and shift the effort on reflecting and reviewing.Also, the overall market condition and my long list of watchlist caused me to have a fear on buying during the breakout. The lack of conviction on the crowded watchlist contributed on this emotional issue at first. But as I progress on choosing better trades and trimming my watchlist. I somehow managed to get in earlier in some trades by executing my buy-before/during-breakout tranching strat.
 |
| 2019W06 Watchlist - So many stocks to watch?! |
 |
| 2019W14 Watchlist - 3 Open Positions and 3 on Priority Watchlist. |
Risk Management...
I was able to manage my overall risk by cutting my losers within planned cut loss level. My average loss is still within -4%. Considering I already done 16 trades. 14 of which being cut losses. The overall impact on my portfolio is only -5.55% so far. I don't know if that number is good, but comparing to my COL port before, I am much more better in terms of total port damage. If I was my old self, those 14 losses would’ve dealt a bigger loss on my portfolio.There was an instance that I widened my cut loss levels by tranching them between 3% and 5-6% cut loss levels for me to be able to stay longer in the trade and to avoid being stopped out early. But this backfired at me as it exposed my capital to slightly bigger risk. I was reminded later on that cut losses are not just about the percentage loss but more importantly about the invalidation of your bias - you’re technical cut. It is more logical to cut your losses once your bias is already invalid instead of holding it longer for hopes that the tide will reverse back.
Filtering better (best) trades...
The past few months have been tough for TF players as the overall market sentiment is still on sideways with the exception of a few outliers. Even multi-year and ATH breakout setups are having a hard time rallying.Some modifications on my system rules are made. One significant change that had a ripple effect on my overall routine was the decision to limit my trades to 52-week high, multi-year and all-time high breakouts only instead of the original minimum of 3-months breakout. The idea came from Isiah De Villa’s and Akio’s TRx presentation summary and from Alpha Centauri’s Rift Live topic. These three people have setups that only trades uptrending stocks that are at a minimum of 52W high, multi year high and all time high breakouts (with the addition of RSI above 70). These type of breakouts move faster, with volume, with momentum or strength and with less resistances. This change also stopped me from trading ‘reversing’ stocks from downtrend and focus on stocks that are already on an uptrend. This change on the system also helped on trimming down my watchlist and gave more conviction on my trades
Another change, or more of like an addition, to the system rules, is the inclusion of the ‘value traded’ filter. To further filter down my watchlist, I added a minimum value traded of 5 million. Although there’s no liquidity issues in virtual trading, this rule will be useful once I jump into live trading where liquidity will play a part on my decision if whether the stock have the right liquidity for my position size.
Routine...
I felt excitement whenever a stock on my watchlist does a breakout during my first few weeks. Especially if there are more than two breakouts in one day. My palms would get sweaty and I would feel the rush to enter trades even if the breakout happens during the morning session then spend the rest of the day worrying if the breakout will continue or will be a fakeout. I managed to minimize this emotion by limiting my exposure from the market. I stopped waking up 5 in the morning just to catch the morning session of the market. I went back to my normal routine. I would wake at my normal times. Bath. Prep. Commute. I would mostly check the market through my investwatcher. If key levels are hit, I would only ‘act’ on it when I arrived on my work and would wait for at least 10:30AM onwards and observe. These refinements on my routine lessened the stress on my trading and allowed me to have more calmness than when I started.Accountability Partner (or Support Group)...
Having an accountability partners (or support group) helped me in working on my weaknesses and improving my strengths. Their positive reinforcements helped get up quickly from when I'm feeling down from losing streaks.They helped pinpoint my mistakes and look for areas of improvement in my trading process. They keep me on track and moving forward. Aside from my family, they are also my source of encouragement.The Results...
 |
| Equity |
My equity curve was declining when I started due to a number of cut loss but somehow flattened towards mid March. Then it finally bounced back up to almost break even. But that dropped at the end of the quarter pulled my curve back down a few notch due to my positions weakened and lost some steam.
 |
| Drawdown |
 |
| Profit |
My drawdown started small and quickly almost tripled during mid-February but slowly curved back down towards the end of the quarter. The same can be observed with my profit curve. My losses at the start are larger than towards the end of March.
 |
| Weekly Gain (Change) |
My weekly gain changes are interesting. It started with a small gain, then transitioned into small losses. Then bigger losses. Then somehow I managed to minimize my losses towards march and finally recovered from it with gains from my position at the end of March.
All these are results I can attribute to the series of refinements on my system. The trimming of watchlist helped me filter better (best) trades and the changes on my routine lessened my trade frequency from 10 trades in February to 6 trades in March. These changes pulled back my drawdowns to a lesser percentage and let my gains grow a bit larger towards the end of quarter.
What to work on (Q2)...
- Improve on avoiding 'Piranha' where small gains turned into cut losses. I have to practice more on executing my technical stop by identifying and acknowledging if my bias is already invalidated. I still have the tendency to hold on to my positions and wait for it to hit the -4% limit of my cut loss before exiting - resulting to slightly bigger losses.
- Work on minimizing the fear of entering during the breakout. Develop the correct mindset to have more trust and confidence in my trade plan and preparations. Be more decisive on executions. Never let a series of cut losses break my trading 'mojo'. If the market invalidates my bias, execute cut loss as planned, and have a buy back strategy if my bias goes back up. Remember the line - you cannot control the market, so control what you can, yourself. Execute as planned! Be like Spock - an emotionless and ruthless vulcan-trader.
- Start practicing on proper position sizing this quarter. Use the recommended 3-4 positions at 25% port allocation for trend follower.
- Minimize the feeling of frustrations when experiencing a streak of cut losses. Instead on fixating whether a trade worked or not, observe and record what I can learn from the trade. Use it.
- Learn and develop a counter on my occasional procrastination. Small tasks done are still considered progress.
(My only) notable trade (so far)...
I've traded this stock before I made the reset on the first week of February. Instead of closing my first position and forget about it, I decided to continue it on paper trade.When the reset was done, the stock was still on my watchlist as it was nearing its ATH price.
(I may have shaded the stock code to avoid hyping, but I'm sure you'll figure this one out if you're also a TF player 😜)
So here's what happened...
 |
| Weekly Chart. 5-year time frame. |
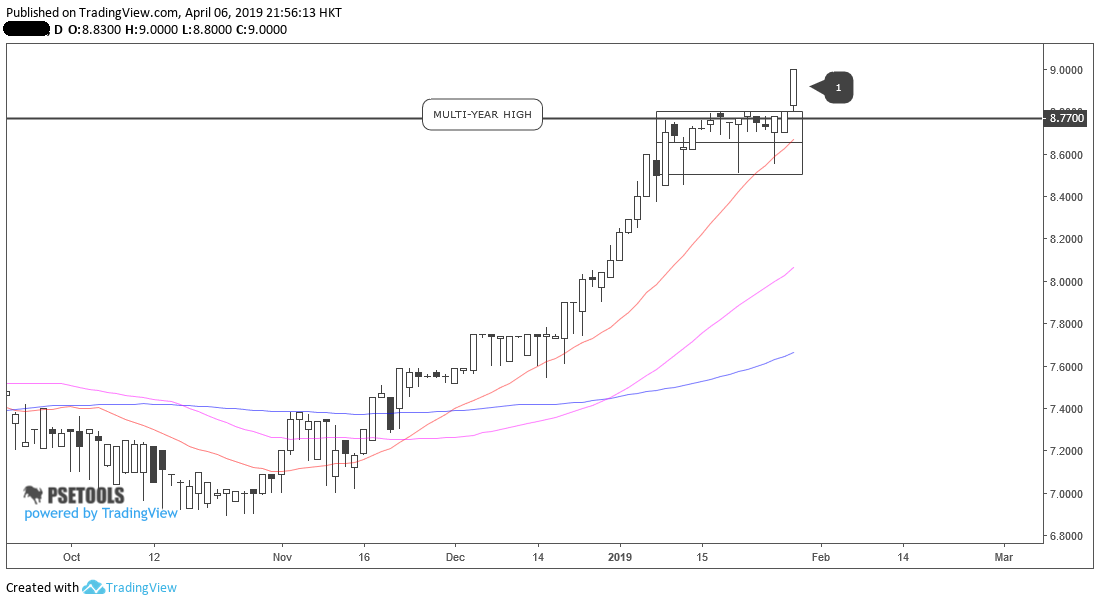
Last week of January:
- I saw this stock's price nearing it's multi-year high resistance and its ATH price on the last week of January. Price is building up between that two key levels (8.5-8.77).
- Stock is in AOTS in weekly chart.
- RSI weekly above 70.
 |
| Daily Chart |
- Price is building up on the resistance area and DB top. Good sign of a 'likely' breakout.
- Stock in AOTS in daily chart.
- RSI daily above 70.
 |
| Daily Chart |
- January 29, 2019 (before reset) - RFB, MAs are in PUA, breakout of Multi-Year Resistance / 52W High. Bought first tranche before recess at 8.93, second tranche at EOD. Conviction on buying intraday: MAs in PUA, RSI Daily and Weekly above 70. Gap up open with volume.
- so after port reset, I continued to trade this in paper trade. But didn't paid much attention on scaling up my shares.
 |
| Daily Chart |
January 29, 2019 (before reset) - Bought the breakout. Then port reset.- February 11, 2019 (after reset) - New position. Gap up at open. I watched as price approached BO point. ATH BO point was hit (10.60). I readied my Buy transaction. Price went higher fast. I hesitated to buy and thought of waiting EOD or at least let the newbie hour pass. But it was about to go out of my buying range. I bought my first tranche (TR1) at 10.80 (10 cents away from the top of my buying range). Closed at 11.00. I forgot to buy my TR2 at EOD. AEP at 10.83
- February 14, 2019 - BO of flag. Bought my TR2 at 11.50 an hour before EOD. Closed at 11.82. ATH play.
- February 21, 2019 - BO of flag. Added some shares at 12.24. Closed at 12.44
- March 20, 2019 - Woke up with a DB BO. Sustained the BO until EOD and closed at new ATH of 12.78. Added 3,000 shares. AEP at 11.66.
- April 5, 2019 - Subtle DB BO. Will wait for a confirmation next week before considering adding shares to this winner. Currently at 42% port allocation.
Honestly, I was ready to sell this stock last week as it was already nearing my trail stop. But that last subtle breakout made this stock alive again. Position still open.

Looking forward to more learnings in Q2!
Good progress, excellent documentation. Thanks for sharing this!
ReplyDeleteThank you. Looking forward to Q2.
Delete